Tenant Metrics & Usage Tracking
Overview
The Tenant Metrics system provides comprehensive token usage tracking and visualization. It supports both UI-based monitoring and programmatic API access for billing integration, cost analysis, and usage monitoring.
Key Concepts
What Gets Tracked
The platform automatically tracks the following metrics:
- Prompt Tokens: Tokens sent in requests (input)
- Completion Tokens: Tokens returned in responses (output)
- Embedding Tokens: Tokens used for embedding operations
- Rerank Tokens: Tokens used for reranking operations. They appear in single-key usage views and API key exports.
- Total Tokens: Sum of prompt and completion tokens
Transcriptions count as prompt and completion tokens, like chat. Some report nothing yet: a model that meters its work in audio seconds has no matching platform metric, and a plain-text response_format returns no usage at all. Those requests are served normally but stay out of token totals — a known limitation rather than a misconfiguration.
Viewing Levels
The metrics system provides three levels of granularity:
- Platform Level: Aggregate view of all tenants
- Tenant Level: Individual tenant's overall usage
- Service Level: Per-service breakdown within a tenant
How It Works
Architecture
The metrics system is built on ClickHouse for high-performance time-series data storage and querying.
Data Collection: Services log token usage to ClickHouse after each model call, tracking prompt tokens, completion tokens, and embedding tokens
UI Access Points:
Tenant Administrators:
- Tenants Page → Metrics Tab: Access tenant-specific usage metrics
- View Toggle: Switch between tenant-level aggregates and service-level breakdowns
Platform Administrators:
- Platform Page: Access platform-wide metrics with per-tenant breakdown, including full tenant-level and service-level analysis capabilities
API Endpoints:
GET /v1/admin/manager/tenants/{tenantId}/metrics- Tenant-level metricsGET /v1/admin/manager/metrics/{serviceId}/timeseries- Service-level metrics
Using the Platform UI
Accessing Metrics
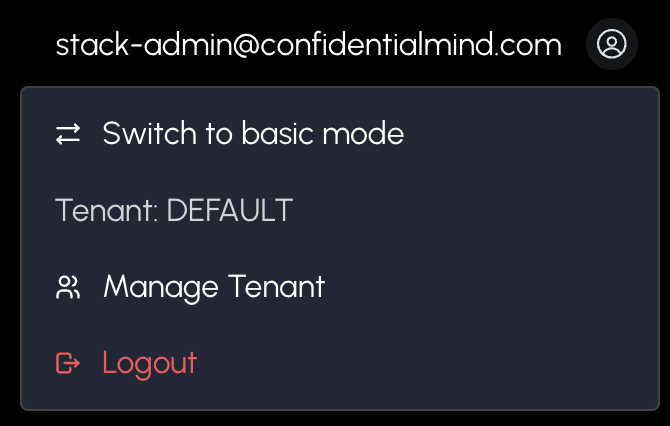
For Tenant Admins:
- Navigate to the Manage Tenant page
- Click Metrics
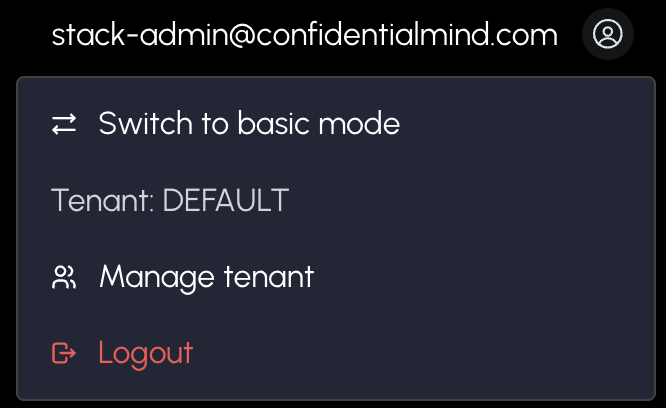
For Platform Admins:
- Navigate to the Tenant admin panel
- Click Metrics or select View metrics for any individual tenant
Time Range Selection
Preset Ranges:
- Last 2 hours (5-minute intervals)
- Last 24 hours (1-hour intervals)
- Last week (1-day intervals)
- Last month (1-day intervals)
Custom Range:
- Use date/time pickers for any custom range
- System automatically selects appropriate intervals
Automatic Interval Selection:
- ≤ 4 hours: 5-minute buckets
- ≤ 2 days: 1-hour buckets
- > 2 days: 1-day buckets
Platform Level View
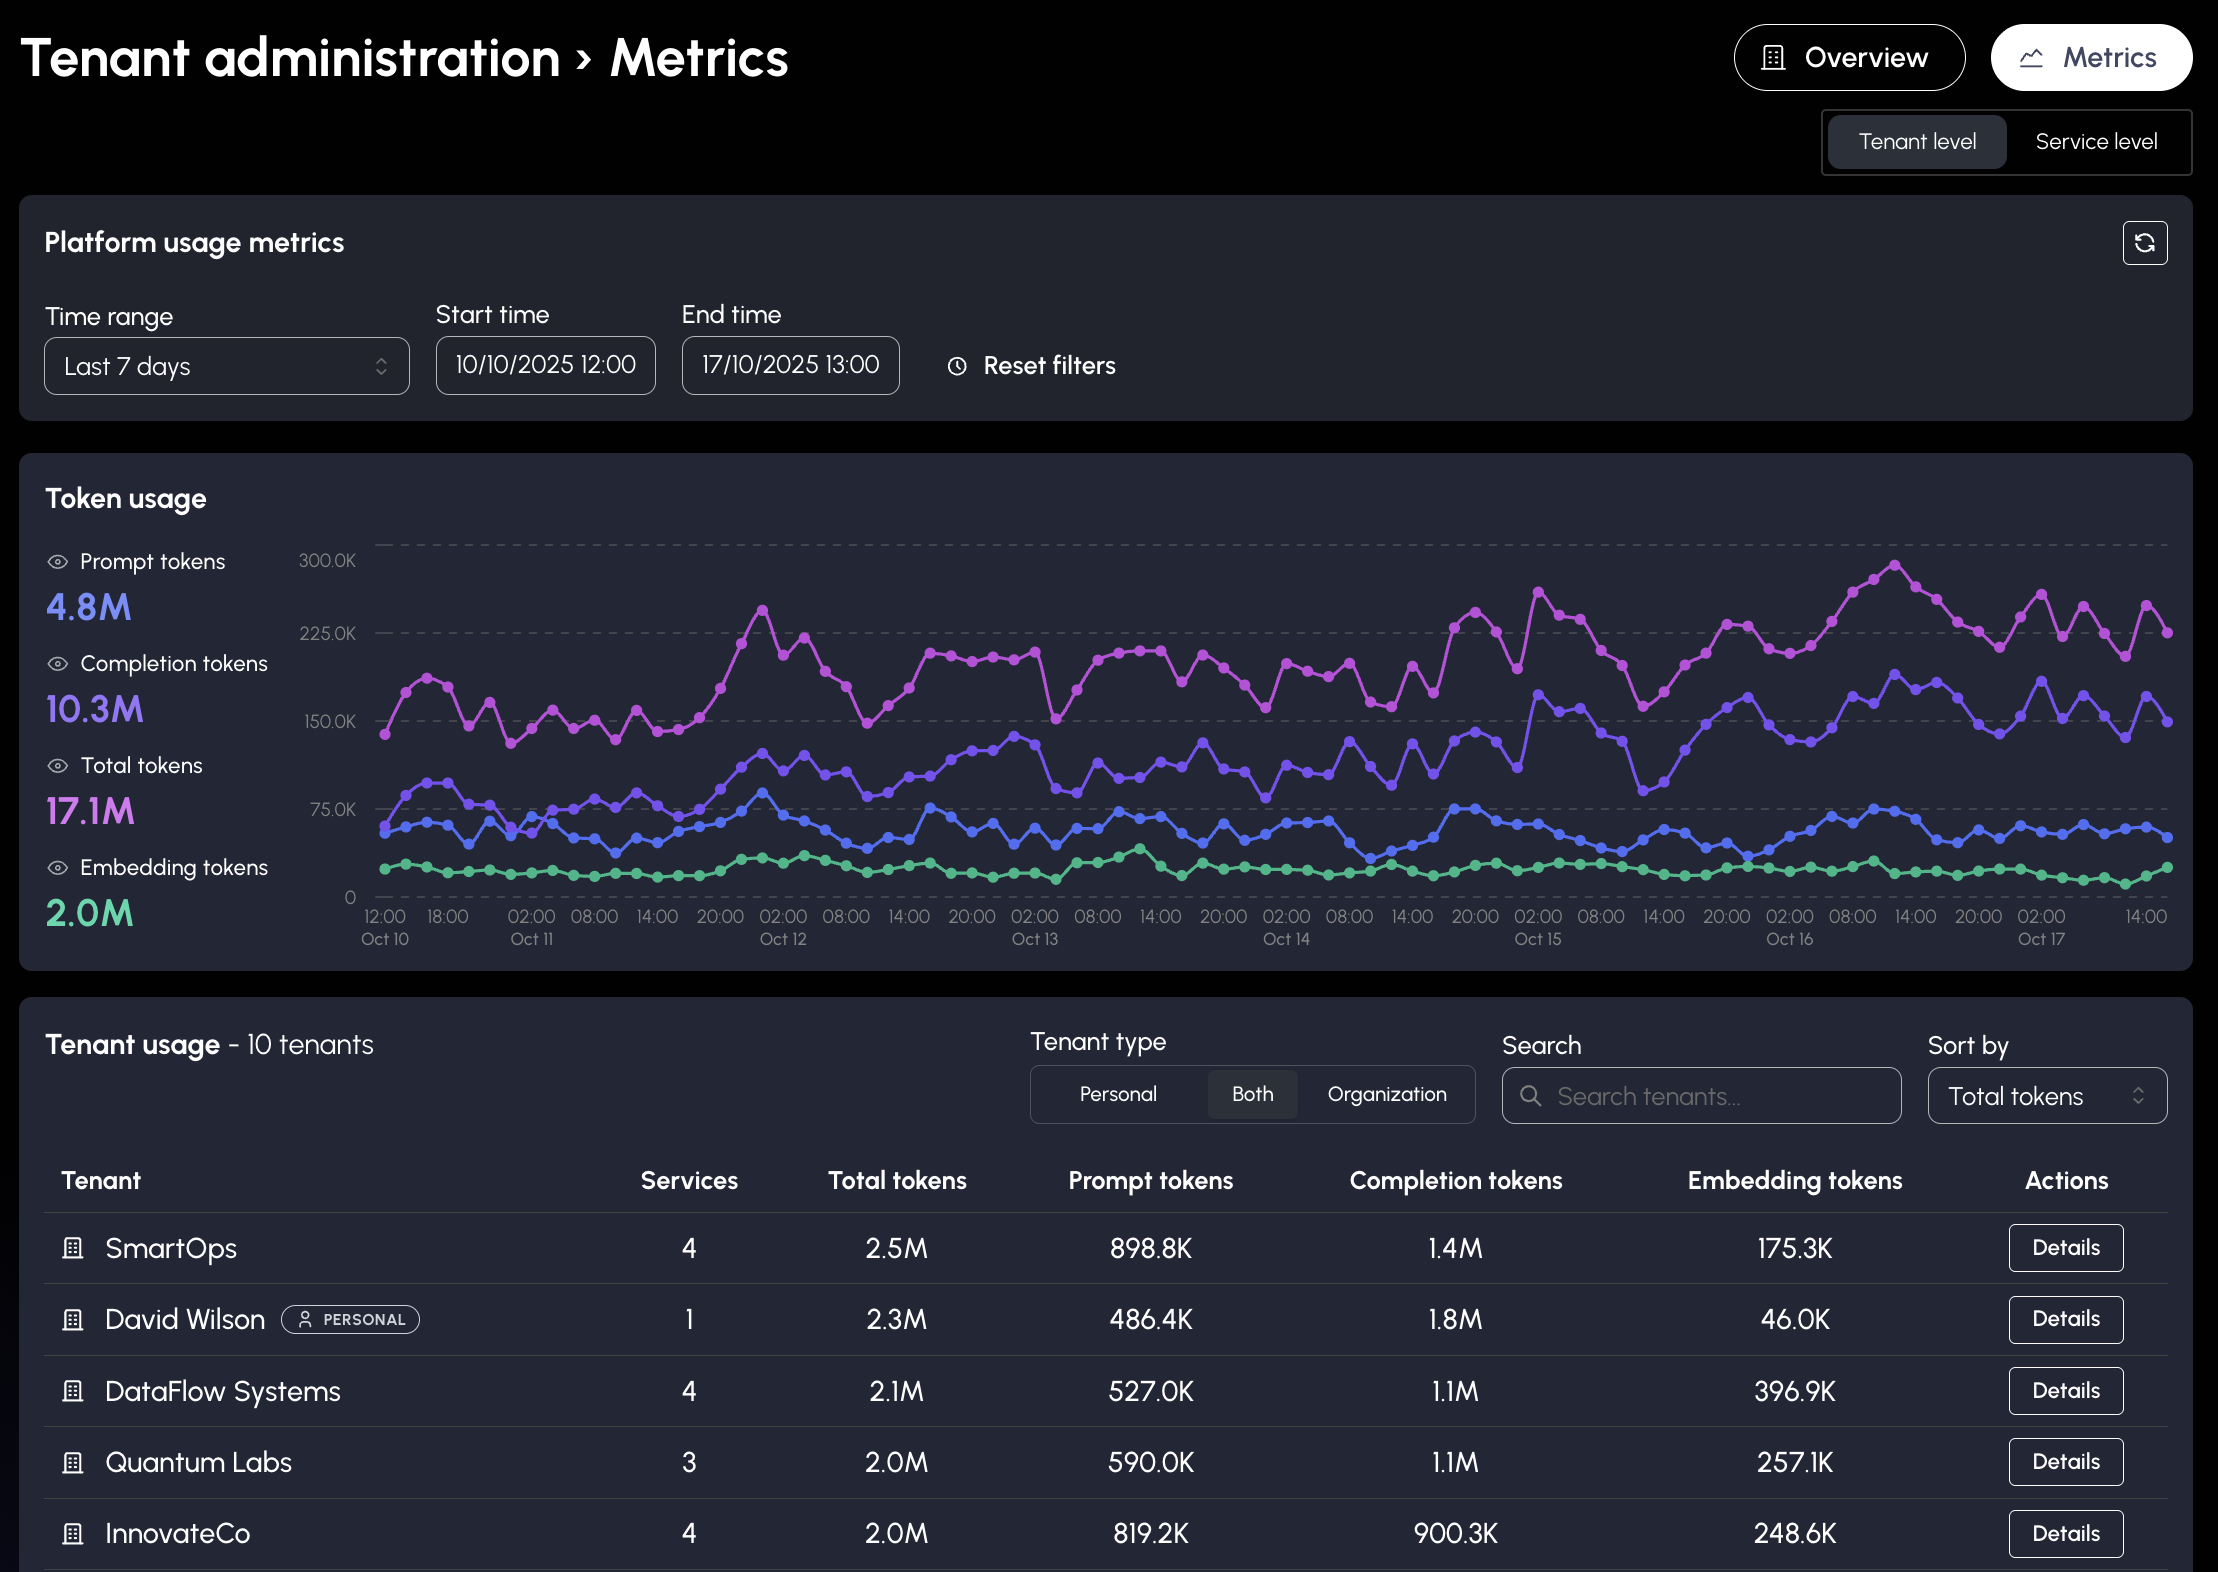
What You See:
- Usage Summary Cards: Total tenants, tokens by type
- Token Usage Chart: Time-series visualization
- Tenant Breakdown Table: Sortable, searchable table with tenant details
Available Actions:
- Search: Filter tenants by name
- Sort: Order by any token metric
- Details Button: Navigate to tenant view
Tenant Level View
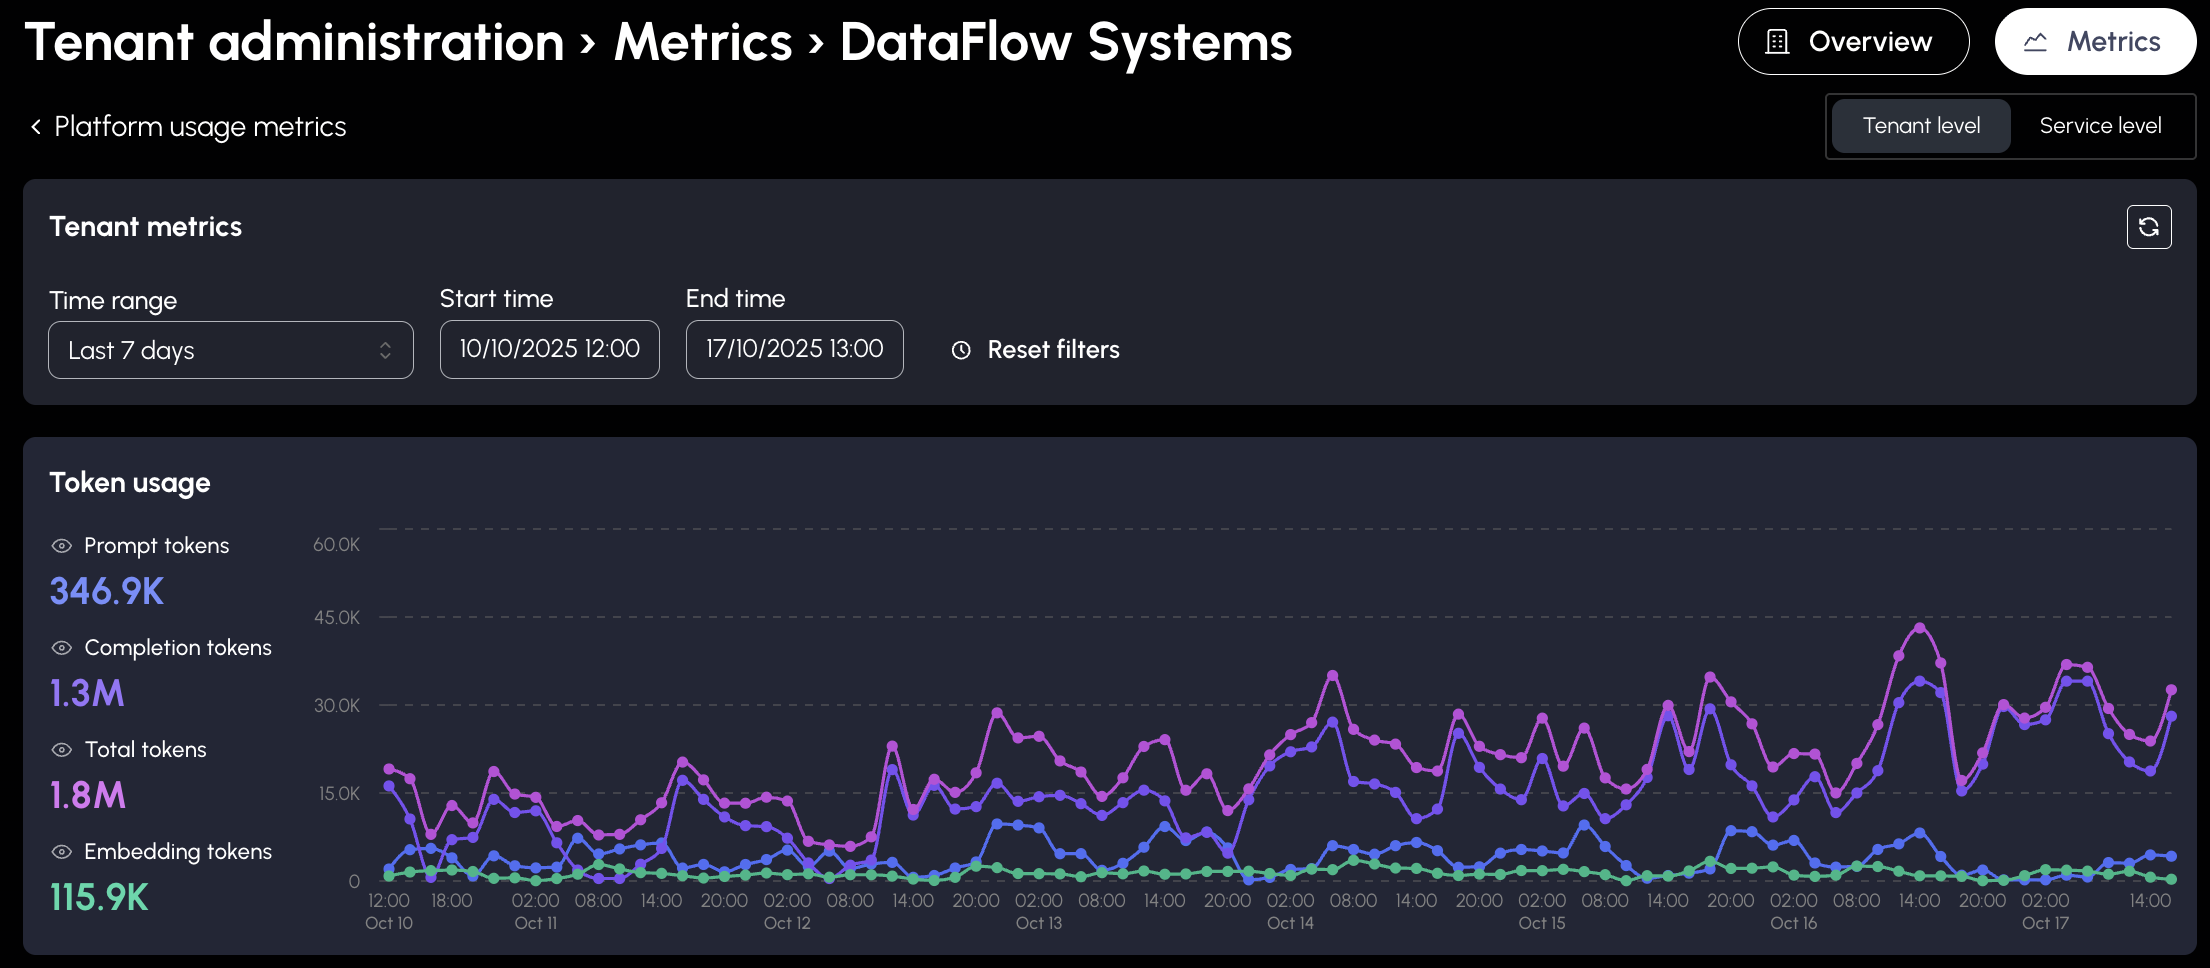
What You See:
- Tenant Usage Summary: Four cards with token totals
- Token Usage Chart: Time-series with prompt, completion, total tokens
- Embedding Token Chart: Separate chart for embeddings
View Toggle:
- Tenant Level: Overall tenant metrics
- Service Level: Per-service breakdown
Service Level View
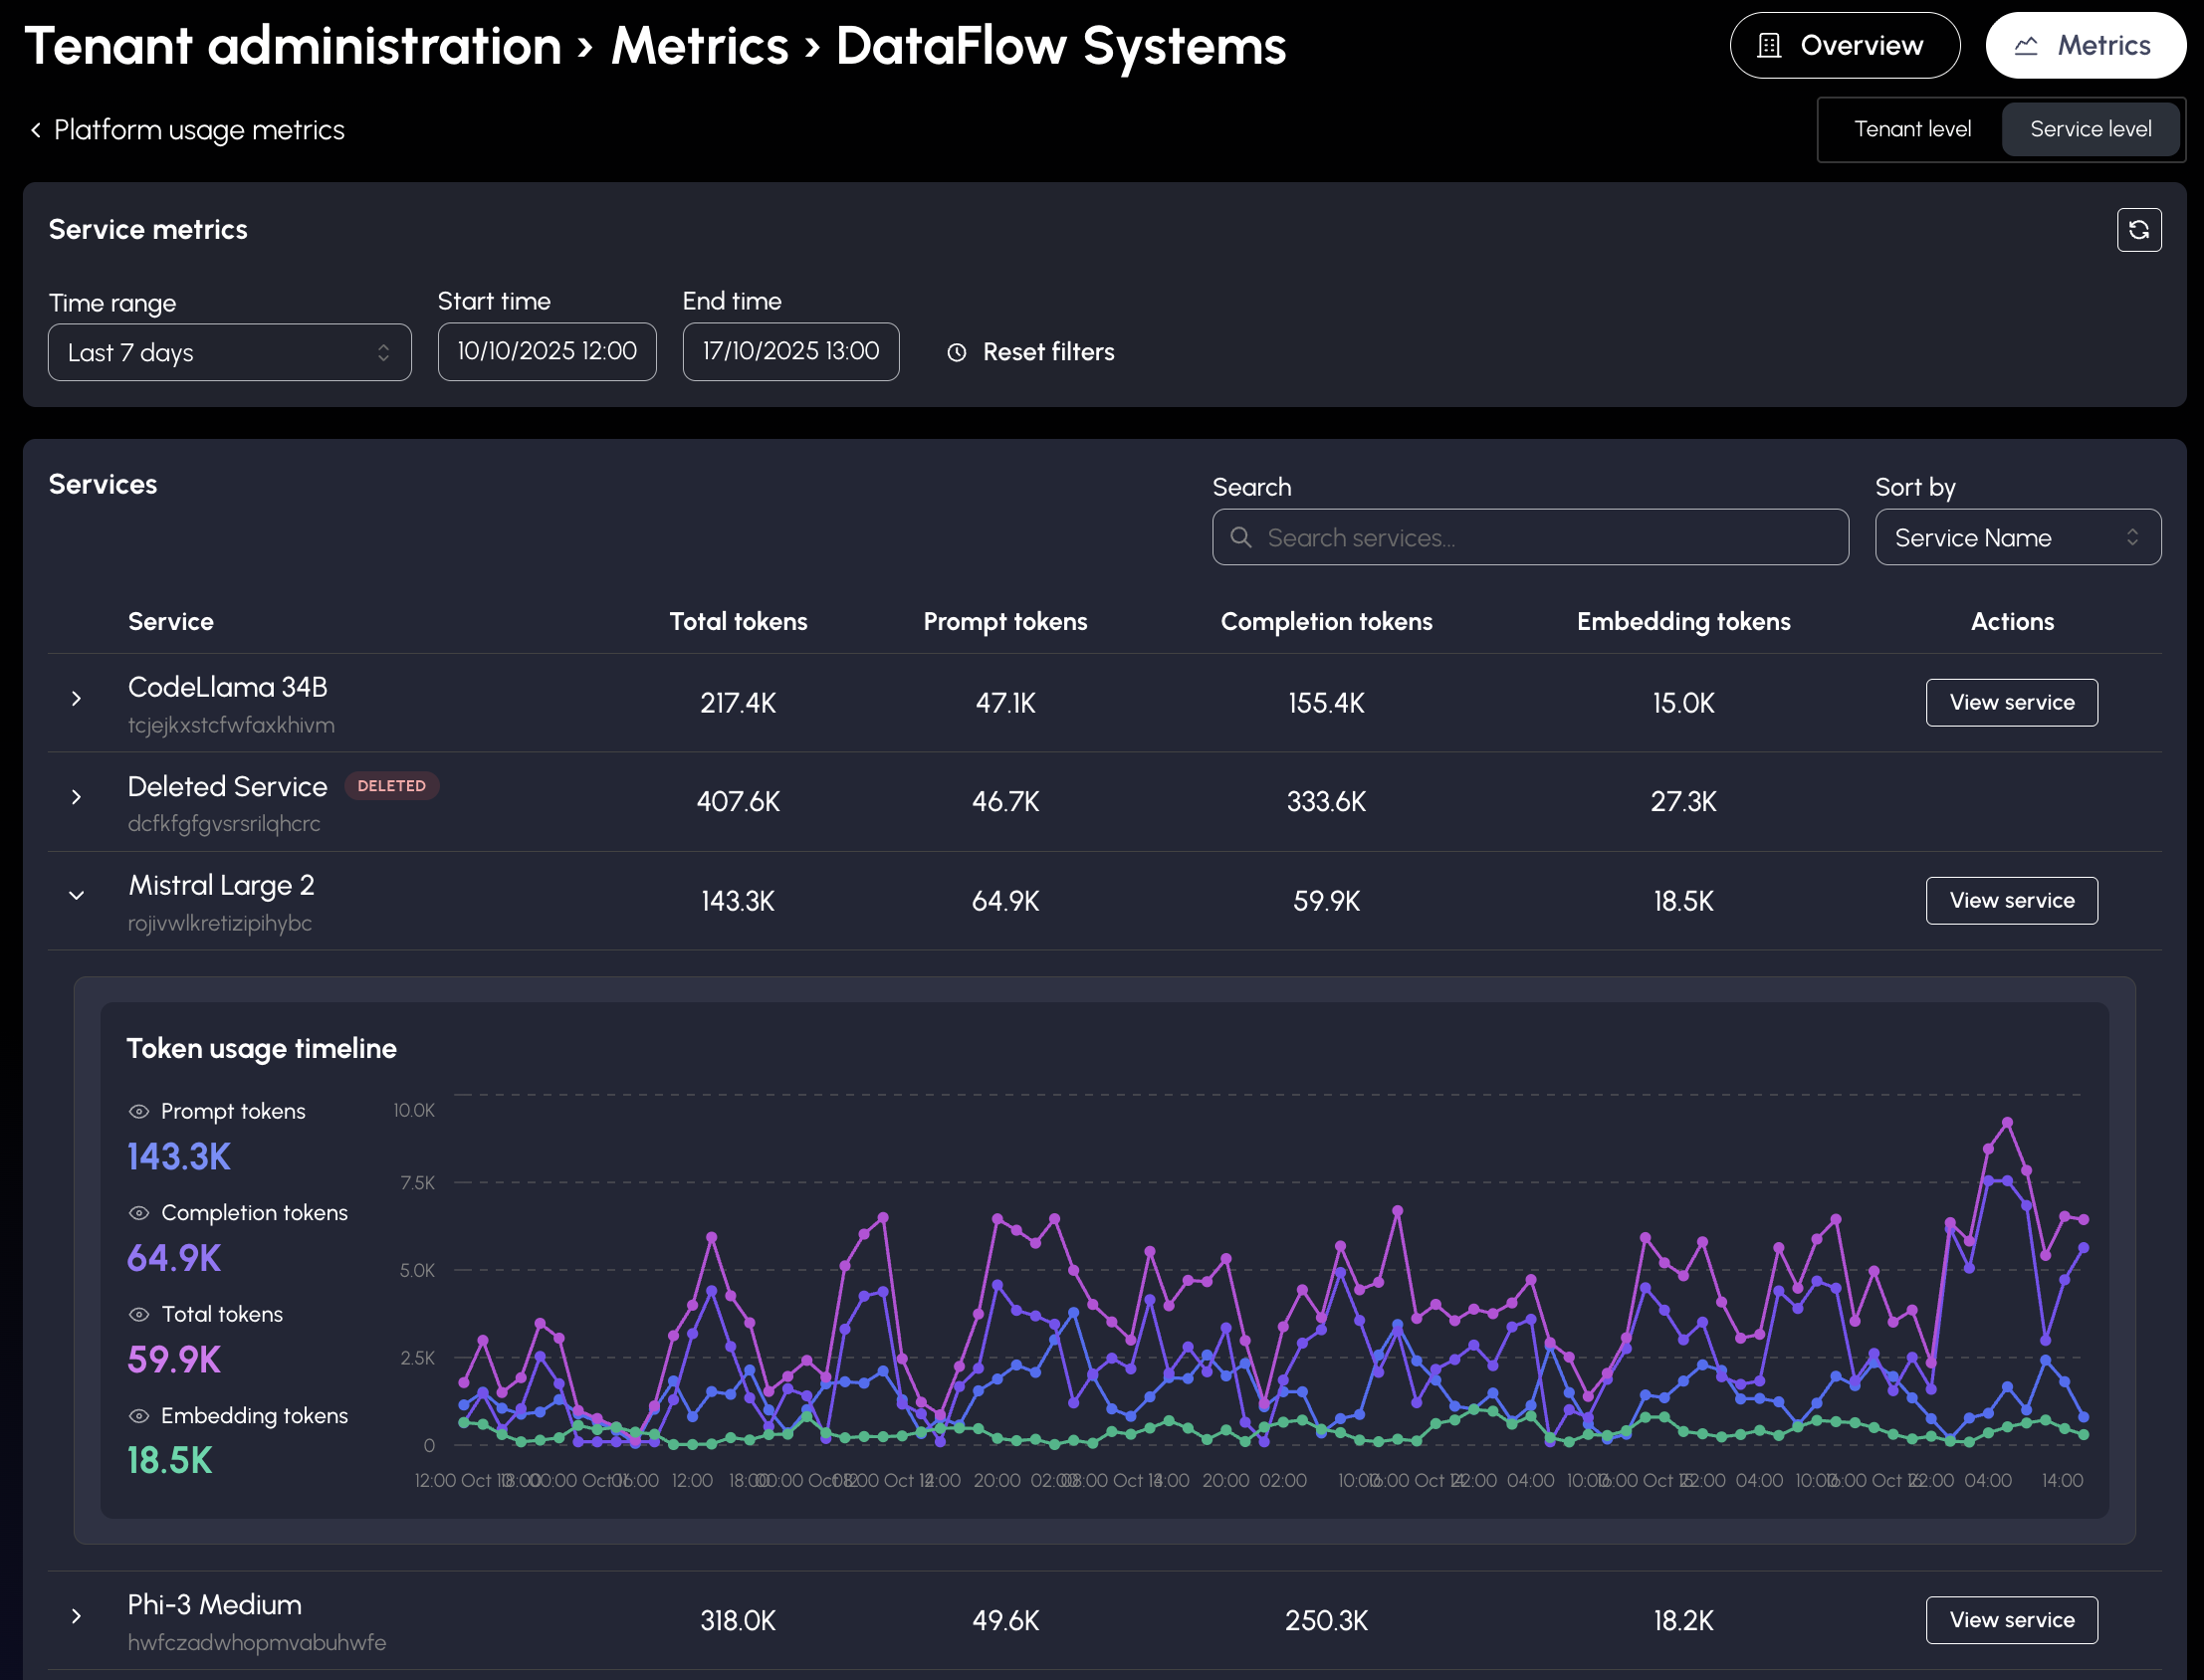
What You See:
- Services List: All services with token usage in selected range
- Per Service: Name, ID, token summary cards, expand/collapse
- Service Timeline: Expandable detailed chart for each service
Filtering & Sorting:
- Search: Find by name or ID
- Sort: By total/prompt/completion/embedding tokens or name
Special Cases:
- Deleted Services: Show in red with "Deleted Service" label and the original service id
- No Usage: Services without usage don't appear
Per-Tenant Usage (Portal)
Platform administrators can see how many tokens each tenant used.
- Open the Platform section.
- Click Usage.
- Set the period with the time-range controls at the top of the page.
The Per-tenant usage table is below the Top models section. It has one row per tenant:
| Column | Description |
|---|---|
| Tenant | Tenant name. If the name cannot be found, the tenant ID is shown instead. |
| Total | Sum of the four token columns that follow. |
| Input | Tokens sent in requests |
| Output | Tokens returned in responses |
| Embedding | Tokens used for embedding |
| Rerank | Tokens used for reranking |
Tenants are listed with the highest total first. Click a column heading to sort by that column. Tenants with no usage in the period are not listed.
Token counts are shortened, for example 1.2K for 1,200 and 3.4M for 3,400,000.
The table uses the same period as the rest of the page. When you change the period, or when Live is on, the table updates with it.
Understanding the Charts
X-axis: Labels follow the viewer's locale, like the other dates in the portal
- Interval of one day: Date, without the year
- Window that covers more than one day: Date at each day start, time on the ticks between. The chart shades alternate days and draws a line at each day start
- Window that stays in one day: Time
Hover label: Follows the viewer's locale. When the period covers more than one day, it shows the date together with the time.
Y-axis: Auto-formatted token counts (K = thousands, M = millions)
Chart Colors:
- Indigo: Prompt tokens
- Violet: Completion tokens
- Grape: Total tokens
- Teal: Embedding tokens
- Cyan: Rerank tokens (API key usage chart only)
Exporting API Key Usage
Tenant administrators can download token usage per API key as a CSV file.
Portal
- Open Models in the tenant sidebar and select the Usage tab. The tab is shown to tenant administrators only.
- Set the period with From and To.
- Click Export API-key CSV.
The file covers the selected period, which is also included in its name, for example
api-key-usage-2026-08-01T000000Z-to-2026-08-06T000000Z.csv. Keys without usage in that period are omitted. See
API Key Usage Export for the columns, row structure, ordering, and attribution rules.
API Reference
Authentication & Authorization
All endpoints require authentication. Authorization varies by endpoint:
- Tenant metrics: Tenant admin for specific tenant OR platform-wide tenant admin
- Service metrics: Service view permissions OR tenant admin
1. Tenant Metrics Endpoint
GET /v1/admin/manager/tenants/:tenantId/metrics
Retrieve aggregated token usage for all services within a tenant.
Primary Use Cases:
- Monitor token usage across an entire tenant over time
- Analyze usage patterns and trends with time-series data
- Break down consumption by individual service within the tenant
Path Parameters:
tenantId(required): Tenant ID
Query Parameters:
start(optional): Unix timestamp in seconds for start timeend(optional): Unix timestamp in seconds for end timestep(optional): Time aggregation step (default: "1h")- Valid: "1m", "5m", "15m", "30m", "1h", "2h", "6h", "12h", "1d", "single"
Response:
{
  "timeRange": {
    "start": 1640995200,
    "end": 1641081600,
    "step": "1h"
  },
  "metrics": {
    "totalPromptTokens": [
      { "timestamp": 1640995200, "value": 45630 },
      { "timestamp": 1640998800, "value": 52100 }
    ],
    "totalCompletionTokens": [
      { "timestamp": 1640995200, "value": 28940 },
      { "timestamp": 1640998800, "value": 35200 }
    ],
    "totalEmbeddingTokens": [
      { "timestamp": 1640995200, "value": 7800 },
      { "timestamp": 1640998800, "value": 9400 }
    ],
    "totalTokens": [
      { "timestamp": 1640995200, "value": 82370 },
      { "timestamp": 1640998800, "value": 96700 }
    ]
  },
  "detailed": {
    "byTarget": {
      "service-uuid-1": {
        "targetId": "service-uuid-1",
        "displayName": "Chat Service",
        "metrics": {
          "totalPromptTokens": [
            { "timestamp": 1640995200, "value": 23150 }
          ],
          "totalCompletionTokens": [
            { "timestamp": 1640995200, "value": 15200 }
          ],
          "totalEmbeddingTokens": [
            { "timestamp": 1640995200, "value": 3900 }
          ],
          "totalTokens": [
            { "timestamp": 1640995200, "value": 42250 }
          ]
        }
      }
    }
  }
}
2. Service Metrics Endpoint
GET /v1/admin/manager/metrics/:serviceId/timeseries
Retrieve time-series metrics for a specific service, including token usage and performance data.
Primary Use Cases:
- Token billing analysis
- Tenant-specific billing filtering
- API key cost tracking
- Service cost breakdown
Secondary Use Cases:
- Performance monitoring (requests, errors, latency)
Path Parameters:
serviceId(required): Service ID
Query Parameters:
start(optional): Unix timestamp in secondsend(optional): Unix timestamp in secondsstep(optional): Time aggregation step- Valid: "1m", "5m", "15m", "30m", "1h", "2h", "6h", "12h", "1d", "single"
tenant_id(optional): Filter by tenant IDapikey(optional): Filter by API keypathFilter(optional): Filter by request path pattern
Response:
{
  "timeRange": {
    "start": 1640995200,
    "end": 1641081600,
    "step": "1h"
  },
  "metrics": {
    "totalRequests": [
      { "timestamp": 1640995200, "value": 150 },
    ],
    "total4xxErrors": [
      { "timestamp": 1640995200, "value": 5 }
    ],
    "total5xxErrors": [
      { "timestamp": 1640995200, "value": 2 }
    ],
    "totalTimeouts": [
      { "timestamp": 1640995200, "value": 0 }
    ],
    "p50Latency": [
      { "timestamp": 1640995200, "value": 245.5 }
    ],
    "p90Latency": [
      { "timestamp": 1640995200, "value": 512.8 }
    ],
    "p99Latency": [
      { "timestamp": 1640995200, "value": 1024.3 }
    ],
    "totalPromptTokens": [
      { "timestamp": 1640995200, "value": 15420 }
    ],
    "totalCompletionTokens": [
      { "timestamp": 1640995200, "value": 8910 }
    ],
    "totalEmbeddingTokens": [
      { "timestamp": 1640995200, "value": 2500 }
    ],
    "totalTokens": [
      { "timestamp": 1640995200, "value": 26830 }
    ]
  }
}
3. API Key Usage Export
POST /cmind.metering.v1.TenantUsageService/ExportTokenUsageByApiKey
Download one CSV file with token usage for every attributed API key in a tenant. The caller must be a tenant administrator for that tenant.
Request Fields:
window(required): The time range, with astartand anend.endmust be afterstart.
The time range includes start and excludes end.
The request does not name a tenant. The tenant comes from the credential you call with: an API key belongs to one
tenant, and a user token must send the tenant ID in the X-Cm-Tenant-Id header. A call that names no tenant fails
with permission_denied.
Response Fields:
filename: Suggested filename, such asapi-key-usage-2026-08-01T000000Z-to-2026-08-06T000000Z.csvcsv: CSV file contents as bytes
CSV Columns:
| Column | Description |
|---|---|
period_start_utc | Start of the requested range, in UTC |
period_end_utc | End of the requested range, in UTC |
api_key_id | API key ID |
model | Model identifier |
input_tokens | Tokens sent in requests |
output_tokens | Tokens returned in responses |
embedding_tokens | Tokens used for embedding |
rerank_tokens | Tokens used for reranking |
The file has one row for every pair of API key and model. There is no summary row for a key and no total column. To get a key's total, add its rows and its token columns together in a spreadsheet or in your own code.
Rows are ordered by API key ID, and by model within each key.
The export is not paginated and has no row limit. It includes every API key with attributed usage in the requested range. If no key has usage, the file contains only the header row.
Only usage that the platform can attribute to an API key is included. Requests made without an API key are omitted, so the CSV totals can be lower than the tenant totals shown in the usage views.
The request fails with invalid_argument if window is missing, if its start or end is missing, or if end is
not after start.
4. Per-Tenant Token Usage
POST /cmind.metering.v1.PlatformUsageService/ListPlatformTokenUsage
Get token totals for one time range, broken down by tenant. The caller must be a platform administrator, and must
call without selecting a tenant: a request that names a tenant fails with permission_denied.
Request Fields:
window(required): The time range, with astartand anend.endmust be afterstart.groupBy(required): The breakdown you want. UseTOKEN_USAGE_GROUP_BY_TENANTfor one row per tenant,TOKEN_USAGE_GROUP_BY_MODELfor one row per model,TOKEN_USAGE_GROUP_BY_USERfor one row per user, orTOKEN_USAGE_GROUP_BY_NONEfor a single total.tenantIds(optional): Tenant IDs to include. Leave it empty to include every tenant. It narrows the rows and is independent ofgroupBy.limit(optional): Most rows to return, highest total first.0means no limit.modelIds(optional): Models to include. Leave it empty to include every model.userIds(optional): Users to include. Leave it empty to include every user.
The time range includes start and excludes end. The result is not split into time buckets. Each row gets one set
of totals for the whole range.
Response Fields:
window: The time range the totals cover.groups: One entry per row, with these fields:
| Field | Description |
|---|---|
groupKey | The tenant ID, model, or user ID the row is for. Empty when groupBy is TOKEN_USAGE_GROUP_BY_NONE, or when the usage cannot be attributed. |
tokens.inputTokens | Tokens sent in requests |
tokens.outputTokens | Tokens returned in responses |
tokens.embeddingTokens | Tokens used for embedding |
tokens.rerankTokens | Tokens used for reranking |
Rows are ordered by their four token counts added together, highest first. Tenants with no usage in the range are not returned. The response contains tenant IDs, not tenant names.
Grouping by API key is not available here, because an API key belongs to one tenant. Use
cmind.metering.v1.TenantUsageService for per-key detail inside a tenant.
The request fails with invalid_argument if window is missing, if its start or end is missing, if end is not
after start, if groupBy is not set, or if a value in tenantIds or userIds is not a valid ID.
Usage Examples
Parameters:
{tenant_id}: ID of the tenant{service_id}: ID of the service{api_key}: JWT payload part only- Example: For JWT
eyJhbG...aaa.eyJleHA...bbb.k7GFW...ccc, use only middleeyJleHA...bbb
- Example: For JWT
start/end: Unix timestamps in secondsstep: Time bucket size (1m, 5m, 15m, 30m, 1h, 2h, 6h, 12h, 1d, single)
Total tenant usage (simplest):
GET /v1/admin/manager/tenants/{tenant_id}/metrics?start=1704067200&end=1706745600&step=single
Returns summed token totals for entire period.
Detailed tenant billing report:
GET /v1/admin/manager/tenants/{tenant_id}/metrics?start=1704067200&end=1706745600&step=1d
Returns daily token breakdown for entire period.
Tenant usage of specific service:
GET /v1/admin/manager/metrics/{service_id}/timeseries?tenant_id={tenant_id}&start=1704067200&end=1706745600&step=single
API key usage within a tenant:
GET /v1/admin/manager/metrics/{service_id}/timeseries?tenant_id={tenant_id}&apikey={api_key}&start=1704067200&end=1706745600&step=single
Returns total token usage for a specific API key within a tenant.
Step Selection Guide
Choose appropriate step values based on use case:
- Simple totals:
"single"- One aggregated value - Monthly billing:
"1d"- Daily totals - Weekly analysis:
"2h"or"6h"- Spending patterns - Real-time monitoring:
"1h"- Hourly tracking - Detailed audits:
"15m"or"30m"- Granular analysis
Error Responses
Standard HTTP error codes:
- 400 Bad Request: Missing required parameters
- 401 Unauthorized: Unauthorized or missing authentication
- 403 Forbidden: Insufficient permissions
- 500 Internal Server Error: Server processing error
Data Types
TimeSeriesPoint
interface TimeSeriesPoint {
  timestamp: number;
  value: number;
}
TokenMetrics
interface TokenMetrics {
  totalPromptTokens: TimeSeriesPoint[];
  totalCompletionTokens: TimeSeriesPoint[];
  totalEmbeddingTokens: TimeSeriesPoint[];
  totalTokens: TimeSeriesPoint[];
}
PerformanceMetrics
interface PerformanceMetrics {
  totalRequests: TimeSeriesPoint[];
  total4xxErrors: TimeSeriesPoint[];
  total5xxErrors: TimeSeriesPoint[];
  totalTimeouts: TimeSeriesPoint[];
  p50Latency: TimeSeriesPoint[];
  p90Latency: TimeSeriesPoint[];
  p99Latency: TimeSeriesPoint[];
}
ServiceMetrics
interface ServiceMetrics {
  timeRange: {
    start: number;
    end: number;
    step: string;
  };
  metrics: PerformanceMetrics & TokenMetrics;
}
TenantMetrics
interface TenantMetrics {
  timeRange: {
    start: number;
    end: number;
    step: string;
  };
  metrics: TokenMetrics;
  detailed?: TenantDetailedMetrics;
}
TenantDetailedMetrics
export interface TenantDetailedMetrics {
  byTarget: {
    [targetId: string]: TenantTargetMetrics;
  };
}
TenantTargetMetrics
interface TenantTargetMetrics {
  targetId: string;
  displayName?: string;
  metrics: TokenMetrics;
}